Database-driven state machine screenshots
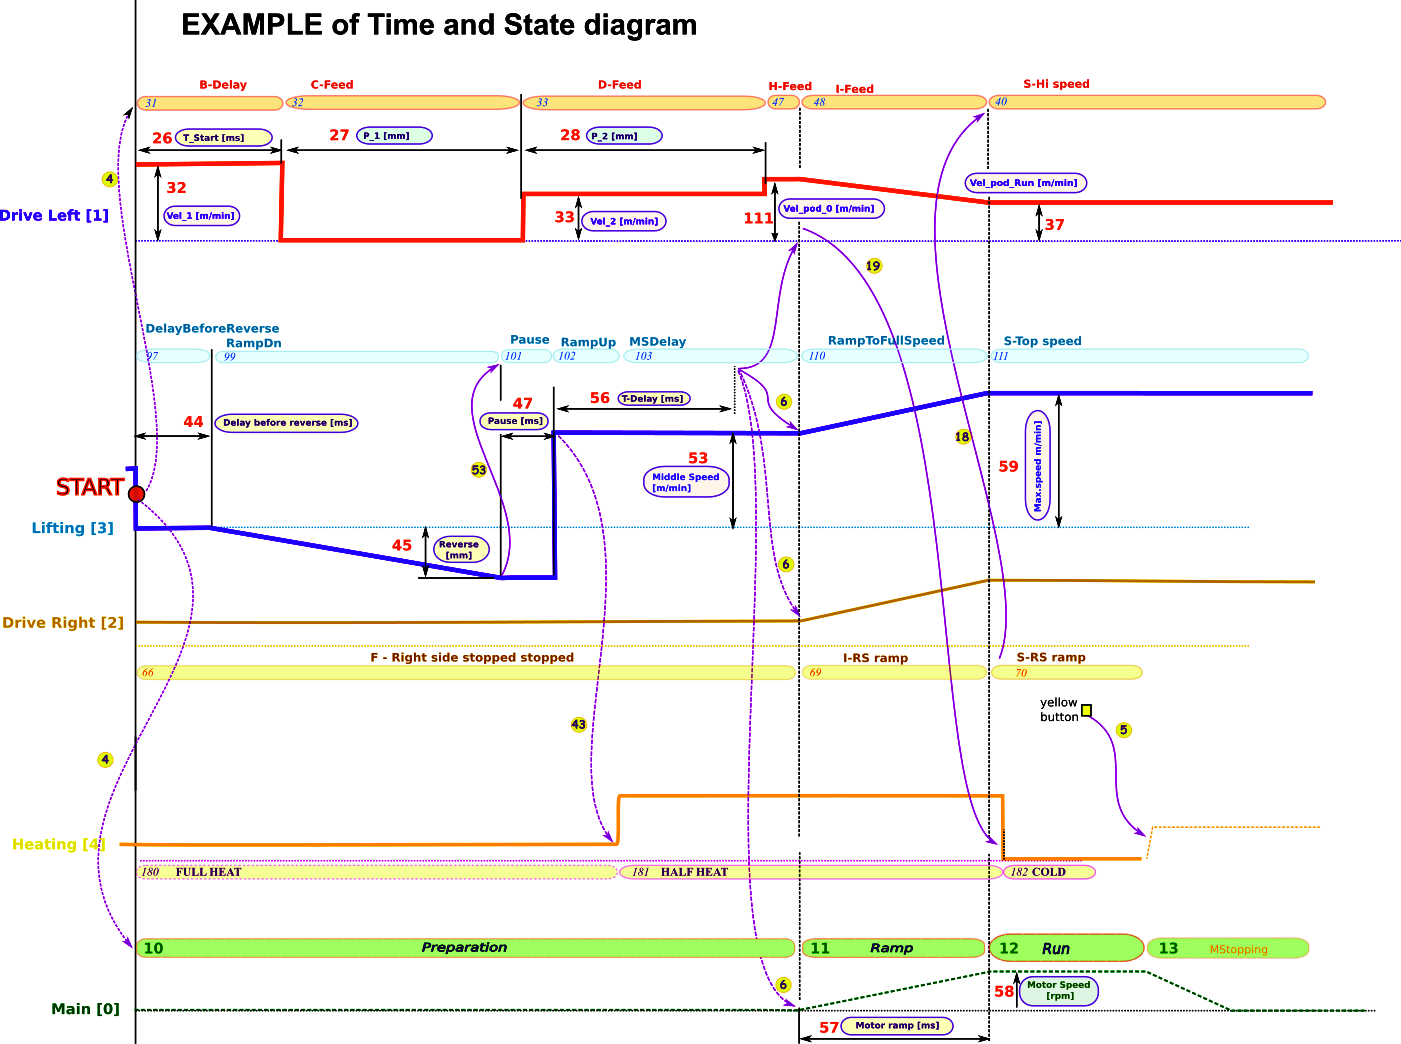
Example time diagram
States
In the time diagram, the horizontal axis is time. Color horizontal line on the graph represent state machines.
Above or below the lines there are ovals with numbers inside it - these are the states.
Violet curves are signals, signal number is in a yellow circle near the curve.
Paramaters
The graph allows easy modification of parameters on the target system.
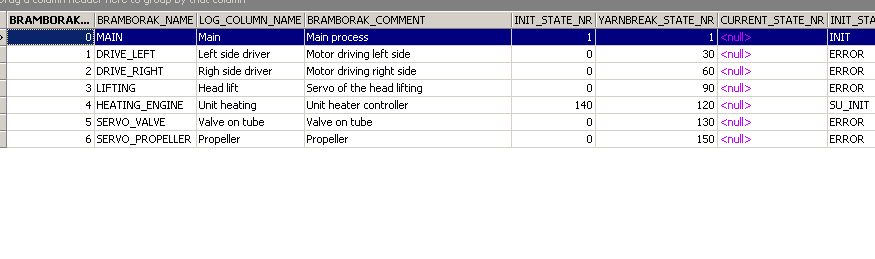
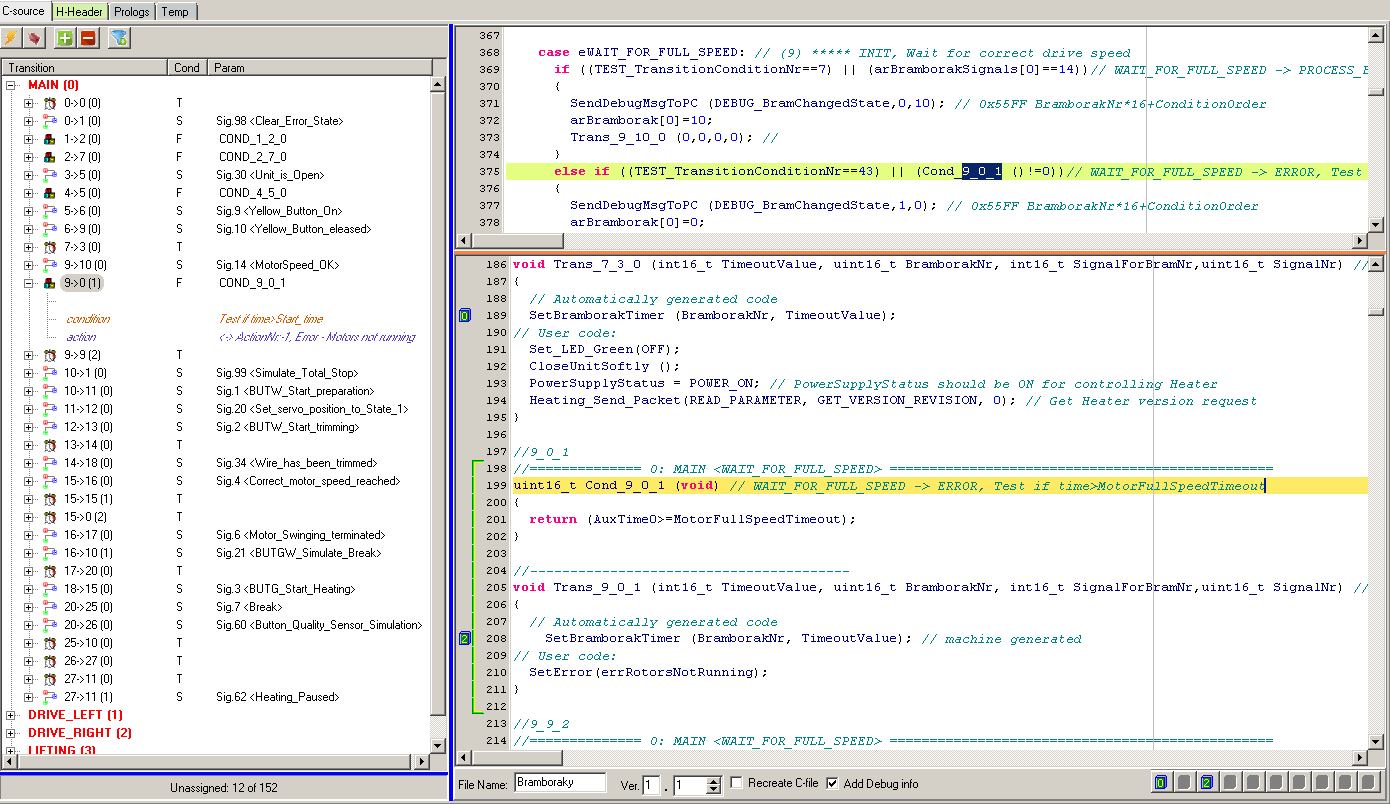
Database - State machine list [Bramboraky]
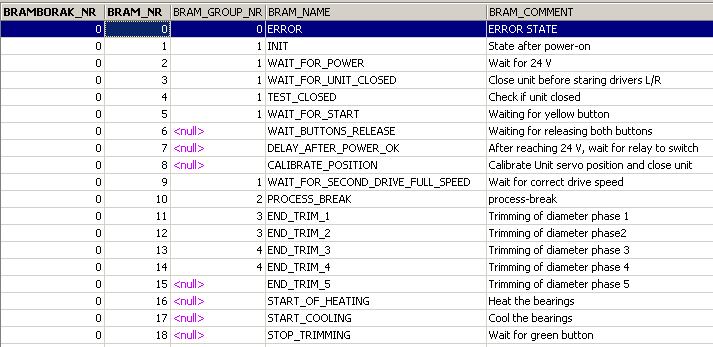
Database - State list [Brambory]
Database - State transitions

Code generator window
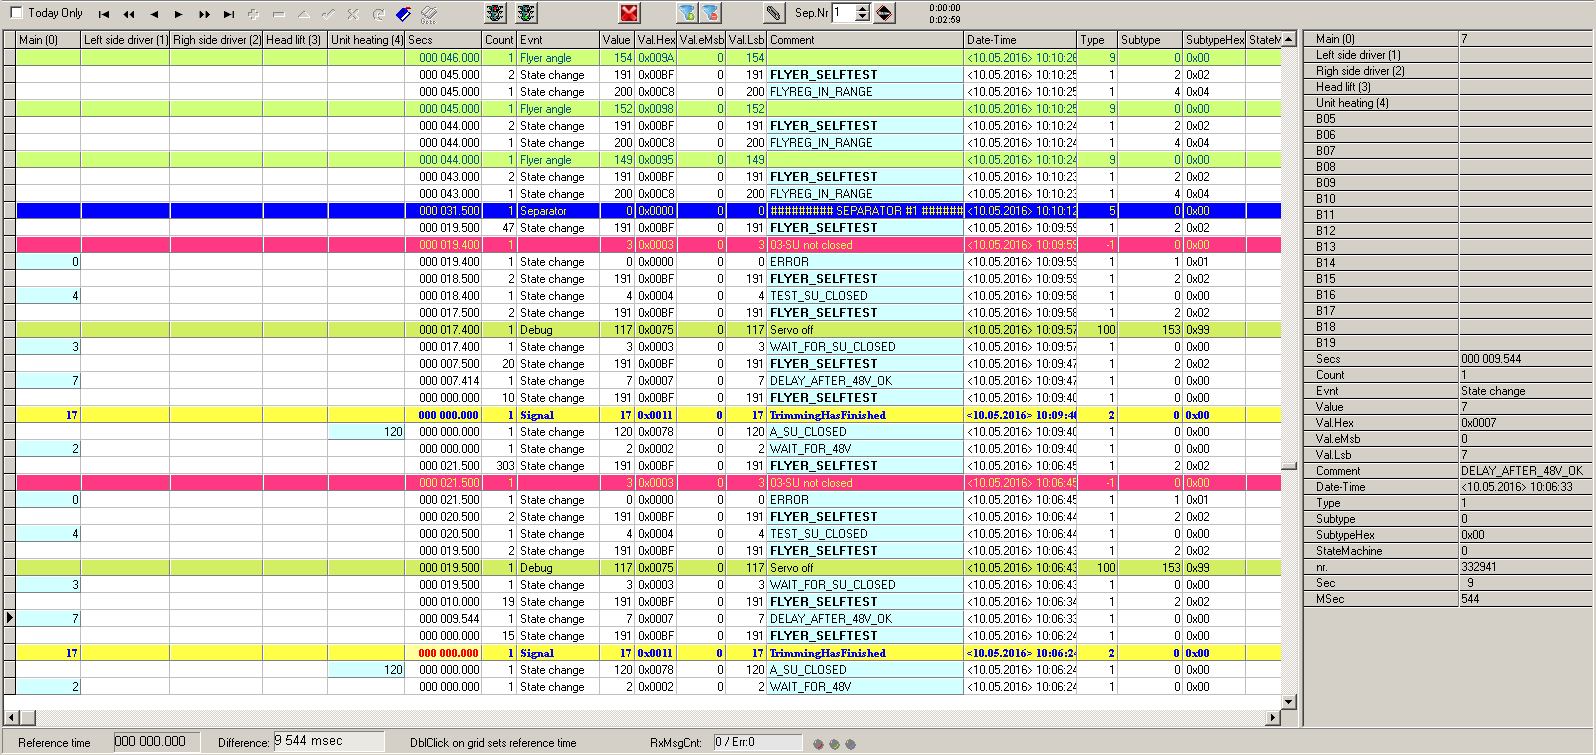
Log window